HOME | DD
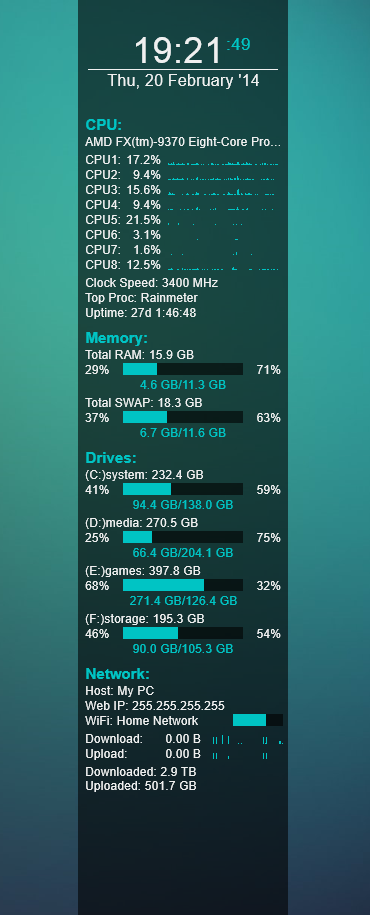
 Broken303 — SysMON v2 [WIP] UPDATE 2.6
by-nc-sa
Broken303 — SysMON v2 [WIP] UPDATE 2.6
by-nc-sa
Published: 2014-02-20 18:49:37 +0000 UTC; Views: 6150; Favourites: 7; Downloads: 1309
Redirect to original
Description
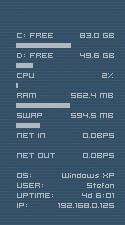
New year, new layout. Previous version: SysOverview [WIP][preview]
Changes:
-added a clock and calendar
-added some color
-better organised meters/measures
-got rid of some unnecessary stuff
Changes in 2.5:
-added 20 different colors
-middle-click skin to circle through colors
This is still a work in progress, so please leave a comment if you find bugs or have any suggestions.
Related content


Comments: 6

Hey broken!
I have a little request...would be nice if you could put cpu temps instead of the cpu histograms....and gpu temps if its possible.
I would like to resize the whole thing...so it would be bigger by like 25%...because if i resize fonts it doesnt look right.
👍: 0 ⏩: 0

Some suggestions-
1. Filter out that (TM) thing that appears in Processor name by adding Substitute="(TM)":"" to the CPU name fetching measure.
2. Graphs look sparse. You can put in a histogram image(rather than a solid color) with less alpha and use a Line meter to highlight the peak points.
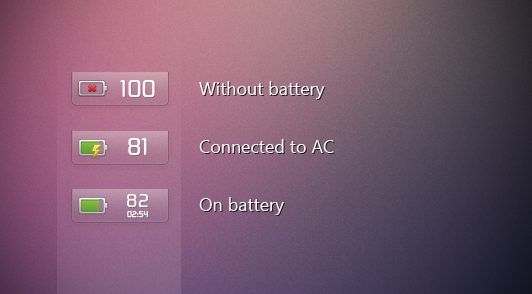
3. On Win8 uptime gets f**ked up due to the hybrid shutdown. I would recommend adding a counter to count the time in use everytime Rainmeter starts with Windows.(Hint: Look for Power 2 skin)
4. Same goes for Up/Download(AAMOF I'm implementing it right now in my upcoming skin.)
5. You can use topprocess.dll plugin to display processes by CPU or Memory Consumption. The number of processes can be specified too.
6. Maybe its better to show CPU clock speed in Ghz.
7. Try adding partition access rates.
I tend to ramble a lot. So dont mind if it becomes too much.
👍: 0 ⏩: 1

some valid ideas, thank you for the input!
1. did not know that was possible, thanks for that
2. could you explain that in more detail or link an example?
3. never really bothered me, but a good idea. i'll look into it.
4. see #2
5. i guess this is for the "top proc" section. my intention for this was to only show the most cpu intensive process to quickly see a troublemaker ^^
6. guess that's personal preference
7. i tried to keep the partition meters somewhat small, and while i like the idea of seeing the access rates, they may destroy their compactness/typography. will look into this.
")
👍: 0 ⏩: 1
2. Something like this-
[MeasureCPU]
Measure=CPU
MinValue=0
MaxValue=100
[CPUGraphBack]
Meter=Histogram
x=82
y=45
h=25
w=60
MeasureName=MeasureCPU
GraphStart=LEFT
GraphOrientation=VERTICAL
AntiAlias=1
PrimaryImage=#ROOTCONFIGPATH#resources \Images\HUD\histo back.png
PrimaryImageTint=#primCol#
[CPUGraph]
Meter=LINE
MeasureName=MeasureCPU
x=82
y=46
h=25
w=60
LineColor=#blue#
LineCount=1
LineWidth=1
AntiAlias=1
GraphStart=LEFT
GraphOrientation=VERTICAL
3. balazslaci.deviantart.com/art/…
4. A network meter that only keeps track of the bandwidth consumption when computer is connected to Internet. Running two counters,one for download another for upload, and adding them up on each update cycle can be an approach. Infact I'm working on it right now.
7. If I were to do it, I would not show both percent of free space and occupied space. One of them should do it. And in that case you got yourself space for access rates. But this is upto to you.
👍: 0 ⏩: 0

repacked and tested. should work now.
👍: 0 ⏩: 0