HOME | DD
 DrMMathArt — Falcon (dampened Lissajous) curve
Published: 2023-11-30 19:45:04 +0000 UTC; Views: 69; Favourites: 0; Downloads: 0
Redirect to original
Description
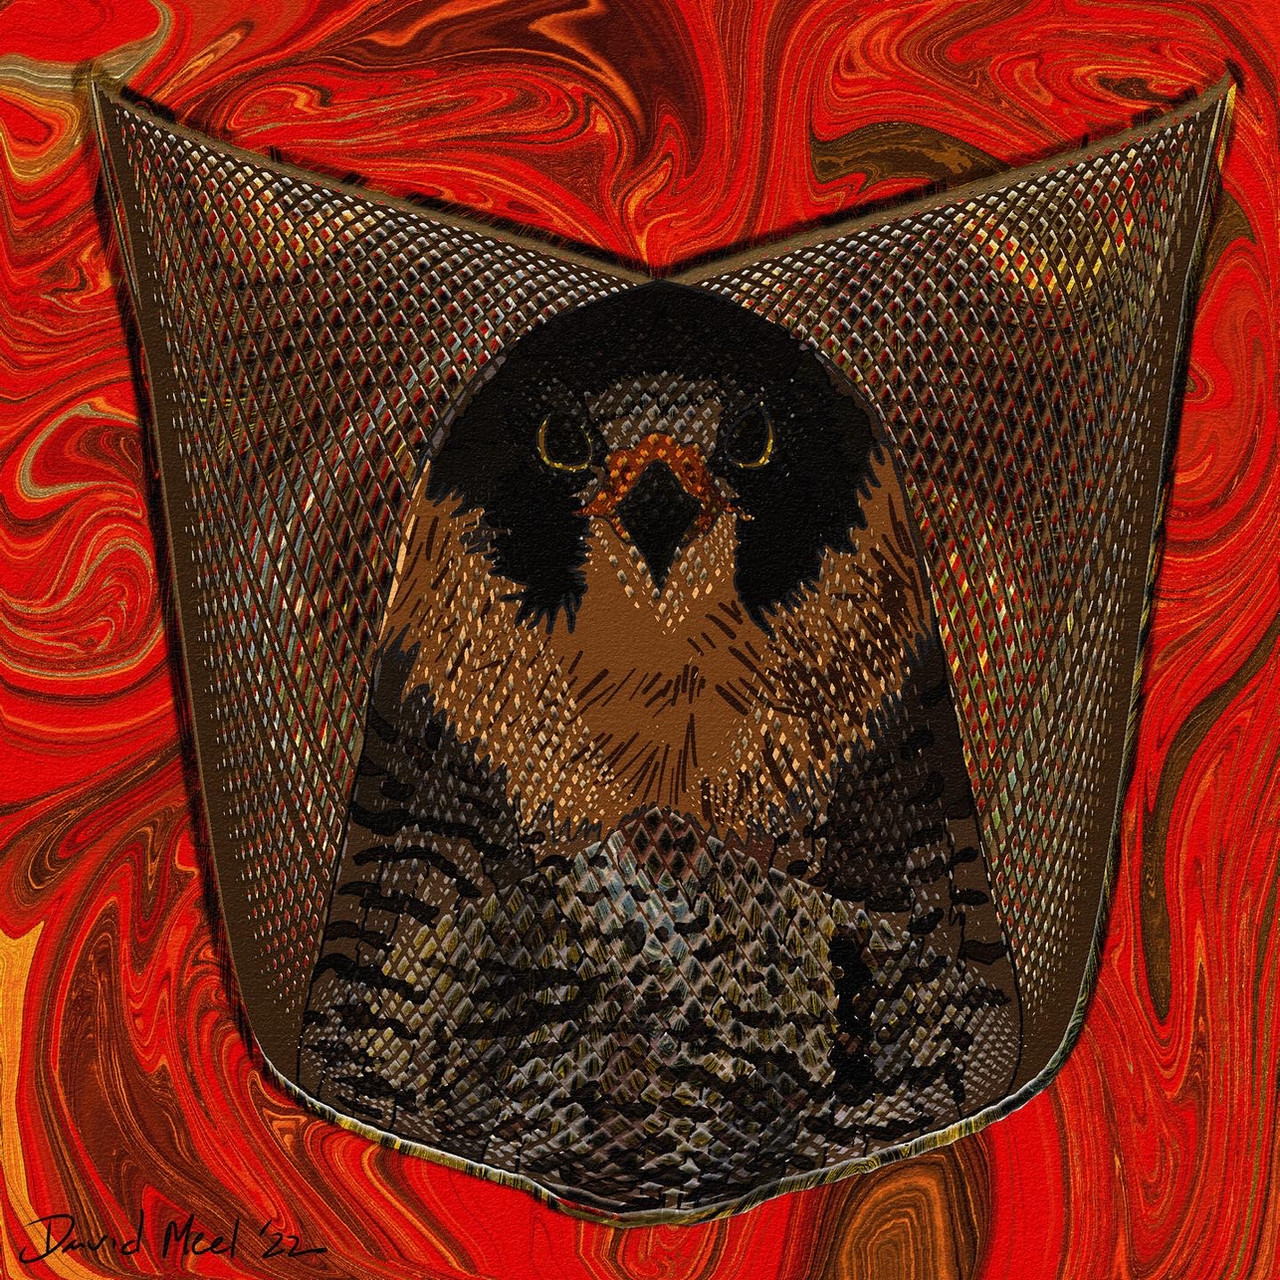
This more subdued version. A normal Lissajous curve defines the point using the parametric equations of sin(at) and sin(bt + p). In contrast, a dampened 2D Lissajous curve utilizes the parametric equations of ct * sin(at) and ct * sin(bt + p)).The inclusion of the ct in the beginning defines the dampening factor and since the amplitudes decay equally over time, the path eventually spirals to the center. If you would like to play with an applet for dampened Lissajous curves, I would suggest examining demonstrations.wolfram.com/ Damped2DLissajousFigures/ or https:/|
observablehq.com/@ccosse/damped-lissajous-figures.
Clearly, Lissajous curves have a strong connection to periodic motion which is connected to motion of a pendulum and taking the perspective of a pendulum helps us understand the dampened Lissajous curve. In the normal Lissajous curve definition, there isn't a loss of energy of the pendulums due to friction (mechanical and/or air resistance).
That is, the amplitude and frequency of the pendulums are not diminished over time. For a nice visual explanation of how the two periodic curves combine to form intricate patterns, l'd suggest watching the video youtu.be/ aUi8SnGGfG8. It shows the two two input patterns defining the singular point which traces out the Lissajous curve. However, real world movement isn't as ideal as the mathematics of pure Lissajous curves which do not take into account energy losses (or perhaps energy gains from some energy input into the system such as a breeze). The dampened Lissajous curve accounts for energy loss but again in an idealized fashion in that the dampening factor is equal in both directions and does not account for energy gains.
The image has a complex connection to mathematics which deserves a protracted explanation. The curve used to define the Falcon is derived from a dampened 2D Lissajous curve. What is a Lissajous curve exactly? It is a curve defined by two parametric equations that are dependent on a variable or parameter. For 2D curves, you define the x coordinate by one function dependent on the parameter and the y coordinate on another function dependent on the same parameter. As you change the value of the parameter, you typically trace out a connected path which reveals the movement of parameterized point over time.
This is the case with most mathematical models, they attend to particular aspects of a real world situation but seek to constrain other aspects in order to control descriptions and simplify models. These models, albeit not perfect, descriptions of real-world phenomena provide understanding to the real world complexities and model the essential relationships. That is the power of mathematics as it serves as a language for simplifying real world phenomena into mathematical relationships and then using those relationships to make predictions and conclusions.
With that said, pendulum based art has become an interesting area of math art. If you are interested in exploring some YouTube videos where pendulum art is shown and the last example is where they used it to paint a car.
youtu.be/uPbzhxYTioM and https://
youtu.be/7RHanp1Xjsc
youtu.be/fY×3NiFGf18 and https://
youtu.be/1J-k2YPCVpk
youtu.be/-as5U3uE3HI
youtu.be/Dauo_TOGFEY
youtu.be/yi5EQZt_FPO
youtu.be/WVHPWYjp494
Each of these videos provide insight into how different media and the shapes on which that media is applied influences the end results. This might be a nice cross disciplinary topic for art, math and science teachers to collaborate on.
In fact, if you are of sufficient age, these images may conjure up a toy from your childhood, the Spirograph. Its connections to parametric and polar graphs from multi variable Calculus are abundant. You might want to check out youtu.be/n7T91LDJ--E but for a careful mathematical discussion of the hypotrochoid, you might want to check out Wolfram Mathworld's discussion of the Spirograph at mathworld.wolfram.com/ Spirograph.html.
The specific parametric functions used tomake this image has c = 1.1, a = 1.32, b = 2.62
and p = 0.65.
There is one additional mathematical topic hidden in the image, a Moiré pattern. This effect was used to create the gossamer wings of the Falcon, I took another virtual acrylic pour pattern and made a mask that mimicked that of the "wings" and then offset that slightly to create the effect. At first, it might not be evident but once explained, you might see it everywhere.
A Moiré pattern is an interference pattern where one grid of opaque and transparent components overlies another grid of similar pattern that is not completely identical but is displaced, rotated or deformed (see https:// mathworld.wolfram.com/MoirePattern.html or
Moiré pattern - Wikipedia). For instance, consider two window screens lying on top of each other and one is slightly shifted. In some areas, the opaque components will be in resonance with each other and in others they won't. The result will be a pattern that is not inherent to either grid but revealed by our perception of the interaction of the two grids.
The mathematics of this resonance is described in the Wikipedia article mentioned above and is left for those interested in it to uncover.
There was a lot of mathematics packed into this image but hopefully it makes you SOAR like the falcons of BGSU.