HOME | DD
 TGonZ0 — SimplePerfMeters 3.0.2
Published: 2015-07-12 21:46:18 +0000 UTC; Views: 260743; Favourites: 448; Downloads: 48983
Redirect to original
Description
UPDATE 3.0.2 - 2024-05-23:Weather skin stopped working. Updated the API key, as the previous one expired.
Changed the GPU label so it is displayed right away.
UPDATE 3.0.1 - 2023-07-24:
Bug fix. CPU freq on CPUmem skin would move when scaled up. Now fixed.
UPDATE 3.0.0 - 2023-07-22:
I decided to update the major rev on this one because I have made a lot of changes. I'll list the changes first, then I'll lay out all the meters functions.
- Updated CPUmem to auto adjust up to 64 threads
- Changed all the deprecated PerfMon measure to use UsageMonitor. No more PerfMon plugin measures used.
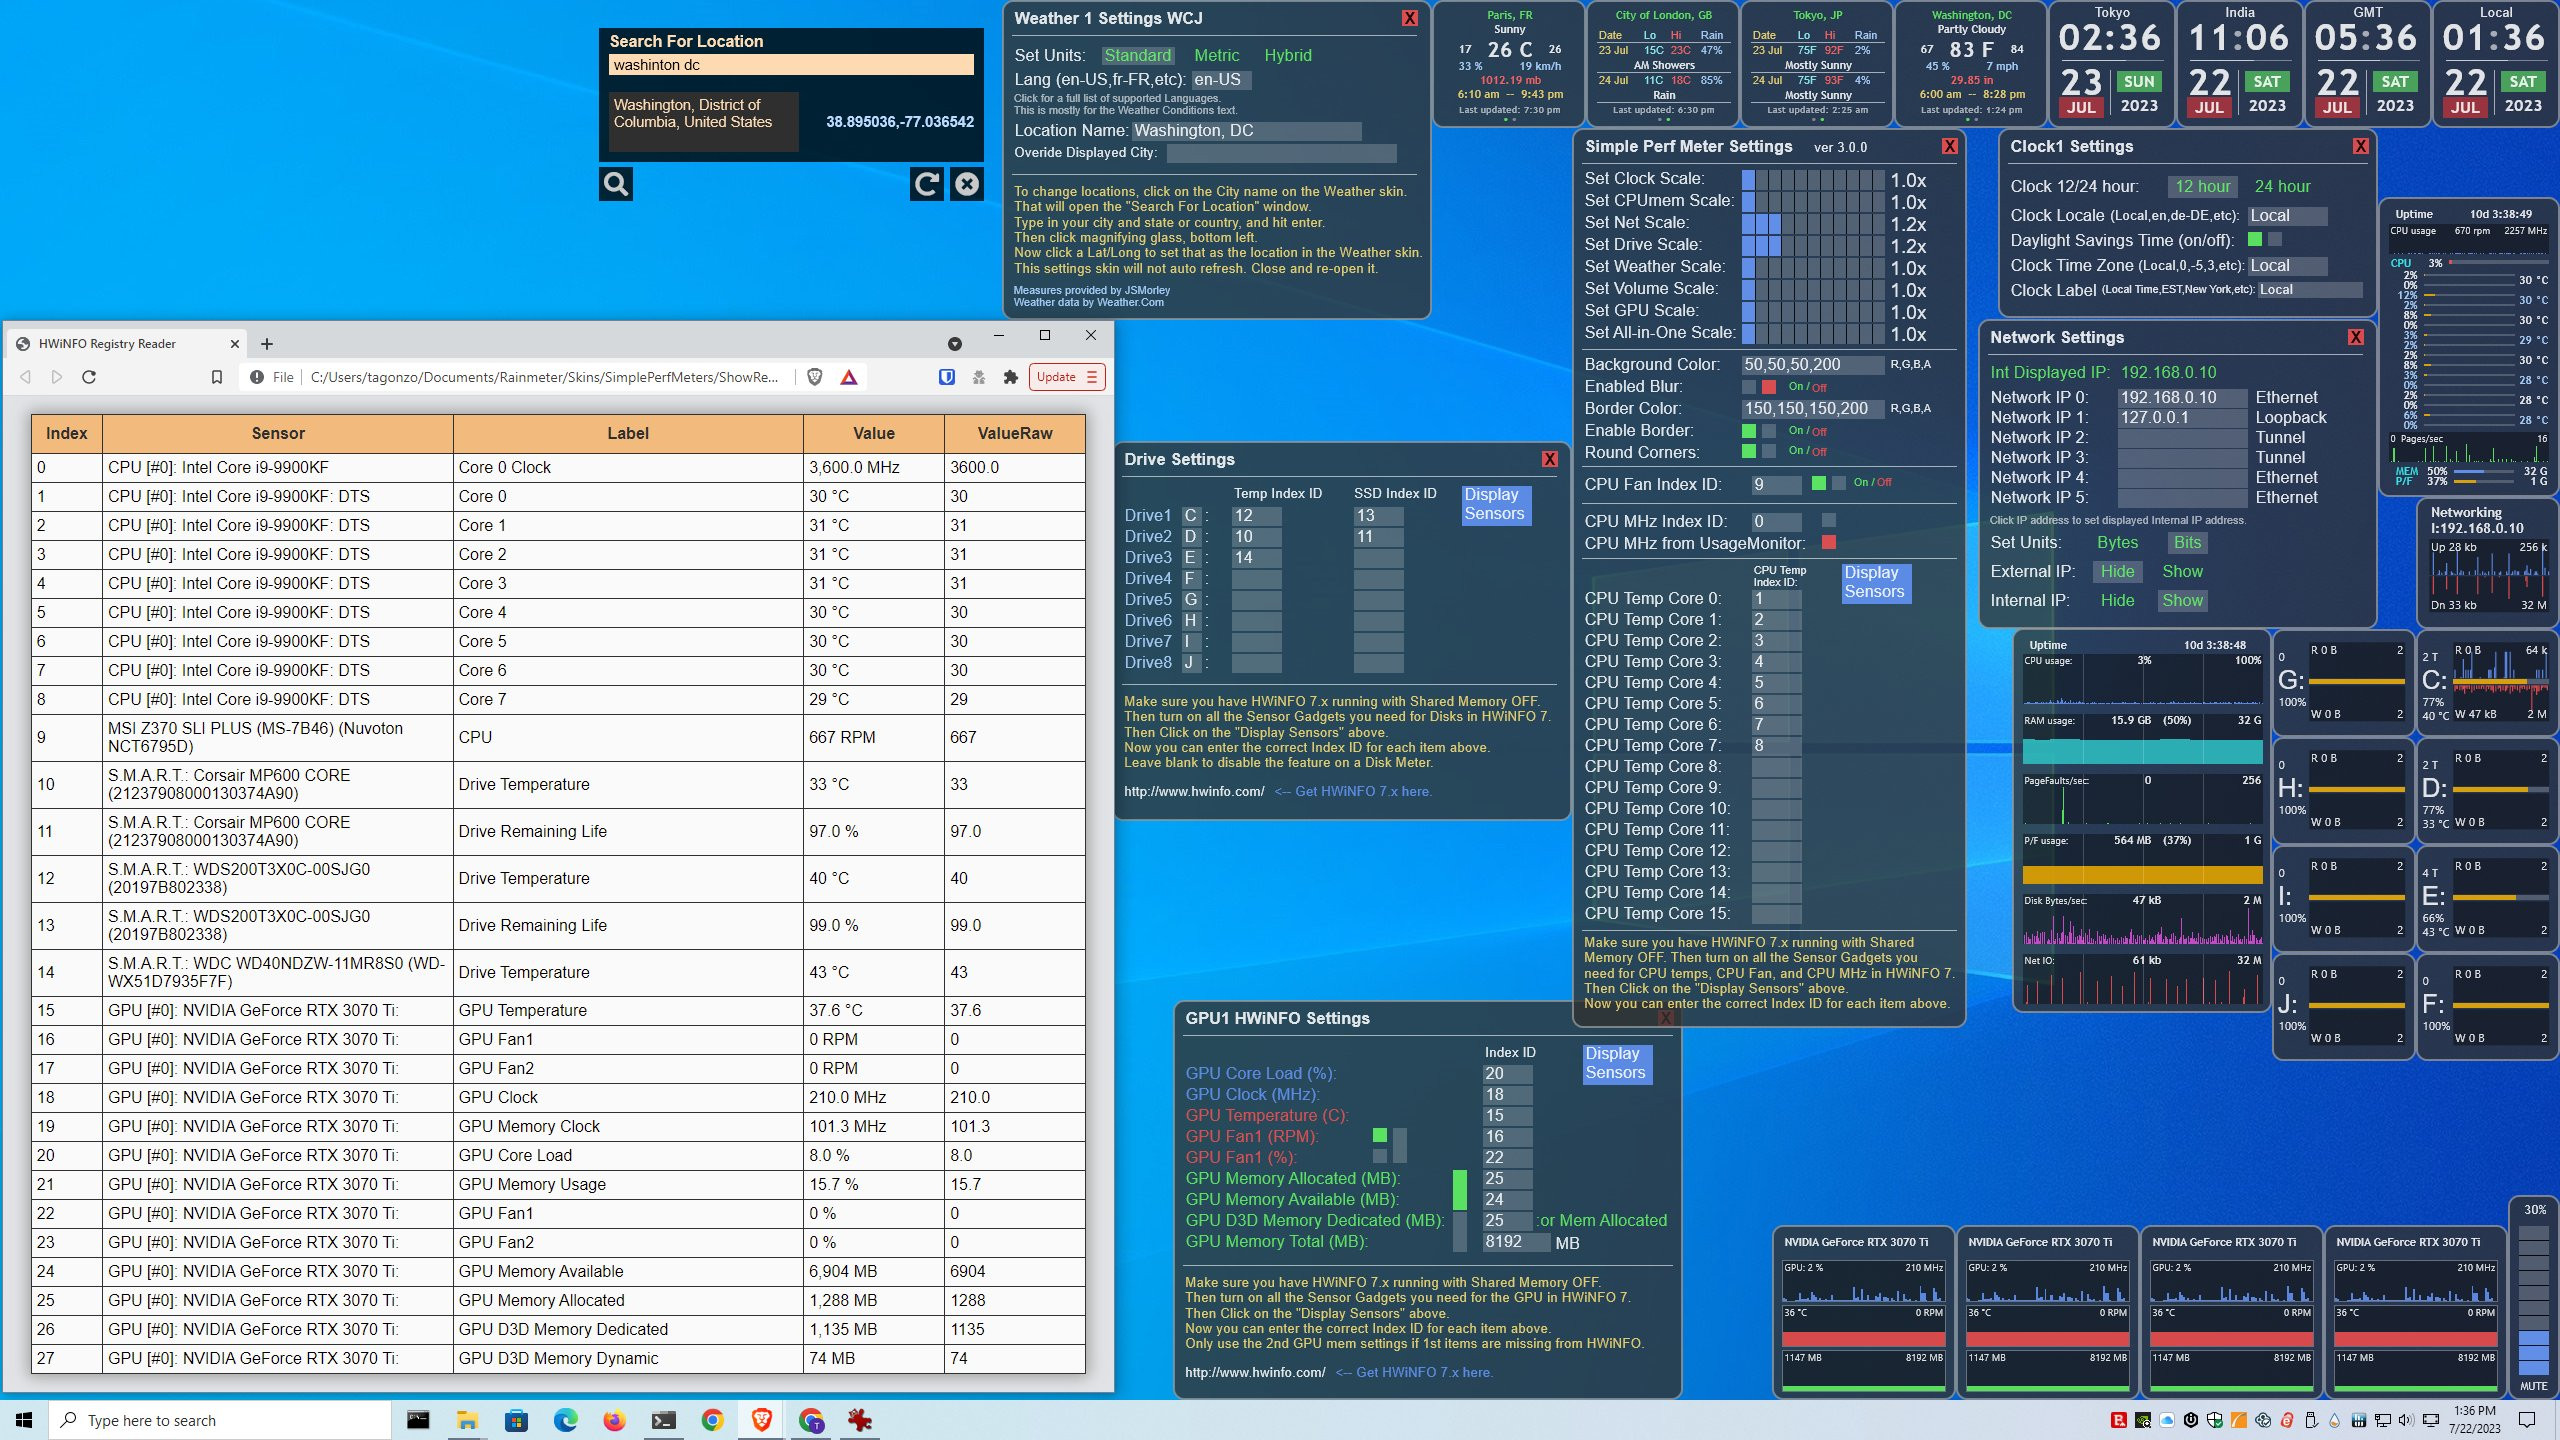
- Changed all of the HWiNFO plugin measures to use the non-plugin Registry method with HWiNFO 7.x. (thank you raiguard, JSMorley, SilverAzide, and others for the ShowReg script to display the sensor Indexes.
- Changed the Weather skins to use JSMorley's WeatherComJSON measures, and added up to 4 Weather skins, and added a two day forecast panel. There are several tooltips on these, so move your mouse around and see what is there.
- Added SSD life to the Drive meters. Requires HWiNFO.
- Added rounded corners, which you can turn on or off.
- Added a border line, which you can change the color and turn on or off.
- Added Blur option, can be turned on or off.
- Can now hide both External and Internal IP addresses.
- Lots of clean up and standardization in my coding. Not perfect, but way better.
To use the new HWiNFO 7.x sensors (without the plugin), you need to get and run HWiNFO 7.x and make sure the Shared Memory settings is OFF. Then you need to go into the Settings, then HWiNFO Gadget tab, and turn on (enable Report value in Gadget) for each sensor you will use. FYI, indexes may change value if you add more sensors later.
On CPU temperatures. With Intel making the latest processors with Performance cores and Efficiency cores, I know the Temperature sensors do not line up with cores exactly in my meters. I think the Performance Cores are actually 2 threads and have just one temp sensor per 2 core(or two threads). Where the Efficiency cores are not threaded and have one temp sensor per core. With many different models of this Processor having different P to E core layouts, I'm not sure how I want to tackle that problem. So the CPUmem skins stay the same as they were for now. You can always use the CPUmem skin with just one temp sensor and use the HWiNFO sensor that represents the whole CPU.
----------------------------------------------------------------------
These are Simple Performance monitoring meters (and a couple of extras) that I wanted for my own use. They are simple looking but provide enough information so I can see if my system is running normally. This became way bigger that I thought it would, but they are all useful. I'll fix any bugs as best I can, and I am trying to slow down on changes to this skin.
There are several clickable locations on the meters. Clicking on any Histogram will start up the Performance Resource monitor. The idea is, you see a meter with high activity, click it to get quick access to the Resource monitor so you can investigate why it is happening.
There are 4 variants of the CPUmem Meter. The original no Temps, and 3 with Temp versions.
CPUmem.ini - the original meter with no Temps, no CPU fan.
CPUmemTemp1.ini - only displays 1 Temp, if you don't want to see every core. CPU fan rpm. Requires HWiNFO.
CPUmemTemp1nocores.ini - only displays 1 Temp, and no individual cores, only the Average CPU usage.
CPUmemTemp1to1.ini - This is more for AMD processors that have 1 core per Temp sensor. CPU fan rpm. Requires HWiNFO.
CPUmemTemp2to1.ini - This is for most Intel processors that have 2 threads per Temp sensor. CPU fan rpm. Requires HWiNFO.
All-in-One meter. I added this mostly for troubleshooting to save 4 minutes of data while I am using full screen programs. Some may choose to use this instead of some of the other meters. I only run this one when I want to see the last 4 minutes of data all in sync. There are 1 minute time lines to help show when the data spike occurred.
GPU meter added. Requires HWiNFO 7.x to be running, and sensors to be enabled for the GPU. Use the GPU settings to fill in the appropriate Indexes to get it working. Not all GPU drivers have all of the settings. So you will need to look at the Display Sensors button and find what you have available and fill them in. Integrated GPUs do not always have all the fields needed.
I did my best to make Settings skins so you would not have to edit any settings files by hand. You can still do that if you like, but the Settings skins should be enough to make it all work.
Any issues getting HWiNFO to run on your system, please visit the HWiNFO site and check their forums for help. www.hwinfo.com/
All in One
- click * in upper right corner to open the Settings to change scale of meters, now auto-hides
- All meters display 4 minutes of data, with 1 minute marker lines
- Uptime
- CPU Usage
- RAM usage
- PageFaults/sec
- PageFile usage
- Disk Bytes/sec (Read and Write combine), currently C: only
- Net IO (In and Out combine) Bits or Bytes follows the Network meter settings
- scalable size
- click * in upper right corner to open the Settings to change scale of meters
- Histogram of average CPU usage
- tooltip of CPU model when mouse over "CPU usage" string
- Bars of average CPU and per thread CPU usage
- CPU temperatures, 4 variants (no temps, only 1 core, 1 core per temp, 2 threads per temp) (req HWiNFO)
- CPU speed in MHz, choose from UsageMonitor or from HWiNFO
- ToolTip on CPU speed will display the Max speed of the CPU, which may not include the turbo or boost speeds
- CPU fan rpm, from HWiNFO, on variants with CPU temps
- click CPU/TASK to start the Task Manager
- click RAM/SYS to open the Control Panel -> System information page
- click P/F to open the window where you can change your Page File
- the CPU bar meters will automatically show only the number of CPUs you have up to 64 threads
- Memory size and usage, tooltip to show available mem
- Pages/sec is when memory allocation went to disk, which slows the system
- P/F Page File size and usage
- scalable size
Simple Perf Meter Settings
- click X in upper right corner to close
- click the bar to change the scaling factor from 1x to 2x in size
- set Background Color for all meters
- set Background Blur on or off
- Enable a Border on or off
- turn on Rounded Corners on or off
- CPU fan Sensor IDs from HWiNFO, with display on/off switch
- CPU Mhz Sensor IDs, choose from HWiNFO or from UsageMonitor, red block = selected
- Sensor ID input for the Temperature readings from HWiNFO, click on Display Sensor to see Indexes
Network Meter
- click * in upper right corner to open the Network Settings, use this if your Internal IP display is not correct
- click Ext IP address to open the Network and Sharing Center
- Network Upload/Download graphs in Bits or Bytes
- scalable size
Network Settings
- click X in upper right corner to open to close
- Can hide both External and Internal IP addresses. Nice when screen sharing.
- this will show up to 6 network interfaces and the IP address assigned to them
- click the IP address to set that as the displayed Internal IP
- Selectable Bits or Bytes
Disk Meter
- click the Drive Letter to open a Windows Explorer to that drive, tooltip shows drive make/model
- click the drive size to open the Restore Point configuration, tooltip for SSD life here if configured
- click Percent Used number to open the Disk Cleanup utility to that drive, tooltip shows available space
- the Center Yellow bar is also space used
- Read/Write graphs in Bytes
- Drive temperature from HWiNFO, can be turned on/off in the Disk settings
- scalable size
Disk Settings
- click X in upper right corner to close
- Type in any drive letter for each of the 8 disks
- Enter the correct HWiNFO index for each drive Temperature and SSD life if available
Clock Meter
- click * in upper right corner to open the Clock Settings, auto-hides
- You can now have 4 clocks running in different TimeZones
- Time on top, with seconds as a thin bar just below the time
- click Time to open the Windows clock settings
- click Month to open a browser link to the current Month
- click Year to open a browser link to the current Year
- in 12 hour mode, the : will be bright for AM, and dim for PM
- added Locale for Month and Day of Week, change in settings, "Local" will use your Windows Locale
- scalable size
Clock Settings
- click X in upper right corner to close
- Up to 4 clocks can be displayed
- Each clock has it's own settings
- TimeZone is only set by number offset from GMT, 0, -5, -9, 5.5, etc (sorry, that is how Rainmeter allows this)
- If the TimeZone is set to Local, it will use your computers TimeZone and DST settings.
- Label is only displayed (at the top) if you type something, anything you like, city, timezone, etc.
- DST Daylight Savings Time on/off
- Select 12 hour or 24 hour
- Locale setting, Local, en-US, de-DE, fr-FR, it-IT, es-ES, etc. It changes the Month and Day of Week.
Volume Meter
- click the volume percent number at the top to open Windows sound settings
- click anywhere on the volume bar to set volume
- scroll wheel also changes volume
- click mute to toggle mute
- scalable size
Weather Meter
- click * in upper right corner to open the Weather Settings, auto-hides
- City, State or Country (click this to open the Location Selector)
- Current conditions, tooltip with longer conditions narrative
- Temps, forecasted Low, Current temp, forecasted High (click the current Temp to open Weather.com to configured City)
- Humidity and Wind
- Atmospheric Pressure
- Sun rise and Sun set
- Click 2 dots at bottom to change to the Forecast panel
- Up to 4 Weather meters
- data is from weather.com
- scalable size
Weather Meter Forecast
- click * in upper right corner to open the Weather Settings, auto-hides
- City, State or Country (click this to open the Location Selector)
- Date, Low temp, High temp, Rain chance
- Forecasted conditions, tooltip for a longer conditions narrative
- Click 2 dots at bottom to change back to Current Weather panel
Weather Meter Location Selector
- Provided by raiguard and JSMorley
- type in City State or County, hit enter
- click search magnifier at bottom
- click on the city name to open in google maps to verify location is what you want
- click Lat, Long to set as the Weather meter location
Weather Meter Settings
- Standard / Metric / Hybrid (mostly for the UK)
- Locale setting, en-US, de-DE, fr-FR, it-IT, es-ES, etc. It changes a couple of fields from the data stream.
- Location name from the Location Selector skin
- If the name is not what you would like from the Selector, you can override the displayed name
GPU Meter
- Requires HWiNFO running
- Up to 4 GPU meters
- Display Graphics card model
- GPU load and graph, also has Core Clock speed
- GPU temperature and graph, also has Fan speed in rpm or % of operation
- Temp graph is 0-100 C
- GPU memory used and graph, and displays the total memory on the card
GPU Settings
- HWiNFO needs to be installed and running first
- click on the Display Sensors button to see the Indexes to use.
- Fill in the sensor Index information
- Pick if you want Fan rpm or % of Fan operation to be displayed, or turn it off
- If HWiNFO has the info needed for the 1st GPU memory data, use it before the 2nd method.
On all Histogram meters, the number on the left is the current sample and the number on the right is the scale of the Histogram.
Internal IP address. It seems the plugin that gets the Internal IP address works well most of the time. If it does not, you can choose the IP from a list that your system currently has configured in the Network Settings.
Background color. I set the default to black and is mostly transparent. (50,50,50,200) That way some color from your wallpaper would show through. If you have a very light or very dark wallpaper, and want a more solid color similar to the blue in my cover image, try using 0,50,100,240. That works good with all the other colors I used in the skins.
FYI, I made these on my Windows 10 system, and have tested it on Windows 11. Should still work on Windows 7 for those couple of people still running it. Requires Rainmeter 4.2 or newer.
Enjoy.
Related content


Comments: 125

Hey, great skin!
I notice there's no place to monitor case fans, would this be easy to add myself or might you be able to add it in the future?
Otherwise keep up the great work!
👍: 0 ⏩: 1

Thanks. I'll look into more fans. Not sure how I will do it yet. Maybe a new meter. We'll see.
👍: 0 ⏩: 0

Thank you so much.Love 2.0.
Excellent clean precise work.
👍: 0 ⏩: 1
Thanks for the nice comments. I also wanted simple clean meters and decided to just make what I wanted.
👍: 0 ⏩: 0

Great skin! Just finished getting it all set up, and am very happy.
Quick question (read: request) - is it possible to add in another volume meter w/mute option for microphone?
👍: 0 ⏩: 1
Thanks, I'm glad you like it. For now, there is not a good way to control the mic from Rainmeter. I've looked around a bit, and have not found anything yet. If a plugin is created that can control the mic, I can look into it then.
👍: 0 ⏩: 2

If your interested you actually should be able to control the mic with Rainmeter using either AutoHotKey (AHK) scripts or NirCmd.
Here's a simple AHK script someone posted on GitHub that toggles muting/unmuting the mic:
github.com/PProvost/AutoHotKey…
You should be able to use the AHK SoundGet command to return the mic volume and the SoundSet command to change the mic volume.
If AHK doesn't work NirCmd is probably your best shot with it's changesysvolume , setsysvolume and mutesysvolume commands.
Bear in mind that in instances where multiple mics are being used the end-user will most-likely need to be able select which mic to control, further complicating things. Controlling the mic probably isn't worth all the effect needed to integrate control with Rainmeter but I thought I'd toss this out there anyway.
Side note
You may want to update the version of the HWiNFO plugin you include with the skin, I've the old one may not run correctly in some instances on Rainmeter 3.3
👍: 0 ⏩: 0
Oh ok, no worries - thanks for looking into it anyways
 (Smile)")
👍: 0 ⏩: 0

REALLY good skin, but I can't believe there isn't an option to show more than one GPU...It has EVERYTHING but that...
👍: 0 ⏩: 2
Hi Emperorr, Well, now it has everything. lol. I added more GPU meters so you can have up to 4 running, each with their own settings window. Enjoy.
👍: 0 ⏩: 1
That was QUICK!
You're the man dude, love the meters!
👍: 0 ⏩: 0
Thanks. I did write most of the GPU skin with GPU0 in most all the variables and measure/meter names, but not all. So, I should be able to fix that, and add a 2nd GPU skin without a huge effort. I'll look into that real soon.
👍: 0 ⏩: 0

How do you configure temperature settings for drives NOT in C-H (2.0.7)? I don't see any obvious ways to add them to diskconfig.ini
👍: 0 ⏩: 1
Hi, I'm not sure I completely understand your question. Did you create more Disk meters above H, and are now trying to add Temps to the Meters above H? And you would like to add Drive temps above H to the Diskconfig.ini skin? If so, it's not easy. Sorry. I can probably clean up that skin, so it is easier to add more Disk temps. What is the highest Drive letter you are using?
Let me know what you mean, and I'm sure we can work it out.
👍: 0 ⏩: 1
Yes, that is pretty much what I mean. Adding the drive meters themselves are easy with the way you have it set up, but adding the temperatures to them through "Disk HWiNFO Settings" window (aka diskconfig.ini) is hard since it is still only C-H in the settings. I have disks B and W. I do see the fields like [measureInputCdriveTempEntry], etc. But I am not sure if copying and pasting and changing the letters will add them in nor do I know exactly all the things that need to be added to get the temp to work for added disks.
It may be too much to ask: But I suggest just simply including every letter in the alphabet by default. They could be organized into a single DiskMeter folder and have each one labeled something like [insert letter]diskmeter.ini. Obviously, I don't know how much work that would be for you or if it would break with the way you have it set up, but at least that system should work with anyone's hard drive setup.
On the topic of disks: This is a very minor issue/bug, but whenever there is no read/write values on the histogram, the maximum values (ones on the right) display "2" instead of "O B" like on the current read/write values (ones on the left). This is actually seen on your preview here with the idle disks. I just thought I mention it if you are still looking for bug reports.
👍: 0 ⏩: 1
To make it a bit easier to add other drive letters, I am changing the Disk Settings skin and putting the code that creates each line into it's own file, and then including that. It should be much easier to copy a the file to a new letter and add another include line. Then do change the drive letter in that new file. I'm still thinking about some other ideas though.
I like the idea of using variants for additional drive letters, but I am also thinking of trying to add a field to just type the drive letter you want for each Disk meter. I'm not sure how each of these ideas will look and work in practice, but I think I can do something different to make them more configurable and still easy to setup. I've tried really hard to make these as easy to configure as I can.
In the Disk Histograms, the number on the right is the max value of the Histogram at that moment. Rainmeter is designed so that Histograms always display a minimum of 0-2. So the max value will never be below 2. That's just how Rainmeter works. So when there is no activity (all values are 0) then the max possible value of the histogram display will still be 2.
You can add the Temps for your B and W drives yourself, manually, without using the Disk Settings skin if you wish. You will have to edit 2 settings files for variables.
1. edit Rainmeter\skins\SimplePerMeters\resources \HWiNFO.inc file
Scroll to the bottom, and copy the 3 variables from another drive, change the drive letter in the new variables, and set the parameters for each.
2. edit Rainmeter\skins\SimplePerMeters\resources \globalsettings.inc file
Find the C:driveTempOnOff=0 settings, copy it and change the driver letter to your new drives.
0 = On
1 = Off
With those changes the Temps should show up on a refresh of the skin.
This manual method should be easier than you trying to edit the Disk Settings skin. And you will have temps until I can work out a better way.
Hope that helps for now.
👍: 0 ⏩: 1
Ok cool. By the way, I did mod in a fix that does mask the "2" on the histogram. I just made a simple IF statement:
if HistMax == 2 then
HistMax = 0
end
I just glued it into FindMaxHistValue.lua right before "return HistMax". So there is at least a way to cover it up.
👍: 0 ⏩: 1
You can make that change for yourself if you like.
But the smallest Max value of 2 is correct, the histogram height represents 0-2 for data values when all data points are 0. The number on the Left is the current new data value, where the number on the right is what the histogram max is set to from auto scaling, smallest value being 2.
I have decided to go with a text field to type in the drive letter you want for each of the 6 drive meters. That way you can have any 6 drive letters you like. I have it working on my system, but I still have to clean up some code a bit, and test it out a bit more.
keep an eye out for a new version soon.
👍: 0 ⏩: 1
Ok, neat. I will look out for it. For the change to the histogram: I think it would be more accurate to display the actual max read/write values shown on the histogram rather than the smallest scale on the histogram allowable by Rainmeter. I don't know, that is just my reasoning for changing it. As long as you are aware of it and it is not a bug, then that is fine.
👍: 0 ⏩: 1
I'll try to explain the numbers I put on the histograms, there is no bug, it is all working properly.
The value on the Left side is the data value that was just added to the histogram. This number on the left should be constantly changing as the incoming data changes. I think this is what you are looking for. Examples:
R 0 B = Read zero Bytes
R 96 kB = Read 98,304 Bytes
W 237 kB = Write 242,688 Bytes
I am using the Auto-Scale feature of the Histogram meter. When the Auto-Scale is used, the histogram will change the range of data values being displayed based on the largest data value in the current Histogram display.
So, it would be a scale of 0-2 when all data is 0 (idle disk). Number in the right of the histogram is 2. The Number on the left will be R 0 B.
When disk activity happens and a Read of say 14530 bytes/sec occurs, (number on left will be "R 14 kB" for one second) the Histogram will change the scale to display data ranging from 0 - 16384, or 0 - 16k. Then the number in the right of the histogram is 16k, and will remain 16k until the data value of 14530 slowly slides off to the left and disappears from the histogram. At that time, a new max will be calculated for the number on the right.
I hope that helps.
👍: 0 ⏩: 1

Everything works great, but I'm having trouble setting up the GPU meter properly. What sensors should we actually be using for MemUseMB and MemUsePercent? I've tried using GPU D3D Memory Dedicated/Dynamic, GPU D3D Usage, and GPU Memory Controller Utilization, but it's giving me wildly inaccurate values. As I type this, it seems to think I have 41GB of RAM on my R7 260x.
👍: 0 ⏩: 2

i.imgur.com/Eu6hqhV.png
These are my Configurations. Unfortunately the AMD sensors not match the NVIDIA, but is ok. On % just select the D3D Usage because is on % on HwInfo...
PS. Keep working on the these. Excellent !
👍: 0 ⏩: 2
That certainly gets closer to an accurate reading, thanks
👍: 0 ⏩: 0
If you could show me the details from HWiNFO and GPU-Z for the AMD GPU, I would like to understand what info is available. Maybe I can make a change to help the AMD display the Memory better.
Here is an example of my system of what I would like to see from your system. And tell me how much memory your GPU has. Thanks.
i.imgur.com/hnZUnw5.jpg
(I use "GPU Memory Usage, %" and "GPU Memory Allocated, MB")
👍: 0 ⏩: 1
i.imgur.com/CG2UYbU.png
Here it is.
👍: 0 ⏩: 0
Yeah, getting the correct sensors can sometimes be a bit tricky. I'll explain as best I can, what I'm using with my GeForce GTX970. I see you have a R7, but hopefully you have equivalent entries to choose from.
I calculate the Max installed Memory on the card based on the Mem Used in MB and the Mem Used in %. As you see, if these are not correct, it will not calculate correctly.
On my card, I see 2 entries for getting the % used.
GPU Memory Usage (%) <-- I use this one.
GPU D3D Usage (%)
As I understand these 2 settings, the D3D is always less because it only shows what GPU memory is allocated for D3D operations. Where the GPU Memory Usage show all GPU memory allocated as a %. Use the GPU Memory Usage (%) for the GPU0 MemUsePercent.
Next for the MB sensor I see 3 possible entries.
GPU Memory Allocated (MB) <-- I use this one.
GPU D3D Memory Dedicated (MB)
GPU D3D Memory Dynamic (MB)
Again, the D3D are only showing a smaller usage of only what the D3D is using. The GPU Memory Allocated show the total about used in MB. Use the GPU Memory Allocated for the GPU0 MemUseMB.
So, as best I can tell, you do not use any of the D3D sensors.
Hopefully your ATI/AMD R7 has similar sensor entries as mine does to choose from.
Hope that helps.
👍: 0 ⏩: 1
I see. Unfortunately my card does not have a "GPU Memory Allocated" sensor value.
I plan to replace it with an Nvidia card soon anyway, so hopefully this is only a temporary issue.
👍: 0 ⏩: 1
If you have a AMD graphics card, get the new version 2.0.7 above. I put some settings for AMD cards in the GPU settings. It's not going to show the full memory allocated, but it will be as close as we can get. AMD does not provide the full mem allocated in it's API.
With the new version, you just type in your cards max memory, and then use the D3D Dedicated memory. That will be close enough.
👍: 0 ⏩: 1
So, funny story.... I just decided to get an Nvidia card today anyway. But I'm sure there are plenty of people who can still enjoy the new functionality. Thank you for your responses and support!
👍: 0 ⏩: 0
Amazing ! Just liked so mutch as my suggestion be realized.
But I will do another suggest to be changed, or a guide to make a change here,
what happen is, the the blue bar from CPU histrogram is showing over the CPU RPM and is bad to see...
Would be possible as on the image anexed that i put here, so the CPU blue bar histogram be limited on the red trace or put the CPU RPM on another place that cannot be over the CPU blue bar histrogram
Sorry my English, cant say you understand what is my suggestion
i.imgur.com/R2NNaS5.png
👍: 0 ⏩: 1
Hi MarcusCorbacho. Your English is good enough, I do understand your question.
You would like to dim the blue of the meter behind the RPM so you can read it better.
That is easy to do. I can add that to a future release. But you can make the change now your self if you like.
Find and edit the file below in notepad or whatever text editor you like. This files is small, so it will be easy.
Make 2 changes so the 2nd section in that files looks the same as below.
Change W=50 to W=45, and then add the SolidColor=0,0,0,100 to the bottom.
Save and then refresh the CPUmem meter.
If you would like the background of the RPM text a little darker, increase the 100 to maybe 150. But 100 should be good enough to make it more readable.
.....\My Documents\Rainmeter\Skins\SimplePerfMeters\@ Resources\CPUmemFan.inc
[meterCPU0MBFanRpm]
Meter=String
MeasureName=measureCPU0MBFanRpm
MeterStyle=styleLeftTextSmall
X=[MeterCPUHistogram")
Y")
W=45
H=12
Text=%1 rpm
TransformationMatrix=#meterScaleCPU #;0;0;#meterScaleCPU #;#meterScaleCPU #;#meterScaleCPU #
DynamicVariables=1
Hidden=#FanOnOffSelect #
SolidColor=0,0,0,100
Let me know how that goes.
👍: 0 ⏩: 1
Humm, was not really that...
In fact is te reduce the lenght of blue histrogram...
On default The blue histrogram starts on below of "z" from "MHz" and it ends after "C" of "CPU" e.g.
My sugestion is, it is possible to blue histogram starts below of "z" from "MHz" and it ends before the "e" from "usage"
So that the blue lines doesn´t pass below of the RPM
I tried editing but no sucess !
👍: 0 ⏩: 1
Oh I see, you wanted to push the text to be above the blue histogram meter, so the blue meter can be seen easier, no text on the blue. That could be done, but would make the meter a bit taller. I meant the CPU usage histogram to be something you just glance at briefly to see if the CPUs have been very busy or if they have been idle for the last couple of minutes. I put the text over the histogram because they are associated to the CPU, and so it would not be a large meter. The Fan rpm was a recent request, and I did not see a better place to put it.
One possible arrangement would be all the text to the left, and push the histogram to the right.
I'll think about some ideas on this. My goal was neat, clean, and simple meters.
👍: 0 ⏩: 1
And if just re-alocate to another position the info of RPM ?
Leave the Blue bars as it is...
And put the CPU rpm between CPU % in use and pages/sec
👍: 0 ⏩: 1
That may be a better look. I've been testing a couple of different configurations.
Make this change to move the rpm to the top center. See if that looks better for you.
Change the X= and Y= in this file, to what I have below:
.....\My Documents\Rainmeter\Skins\SimplePerfMeters\@ Resources\CPUmemFan.inc
X= ([MeterCPUHistogram: X] + 60)
Y=[MeterCPUHistogram:Y]
Save and refresh the CPUmem skin.
Let me know what you think.
There is only one X= and one Y= in the file. So it should be easy.
IMPORTANT: there is no space between the colon( : ) and X above.
I put the space there because it was making a emoticon. When you type this in, do not put a space between the : X.
👍: 0 ⏩: 1
That was what i was thinking !!!!
Now that rocks !
Yes ! You did it !
👍: 0 ⏩: 0

This skin is great. I use it with transparent bachground color - it's amazing.
Only one question: How I could change (CLOCK ) the English name of the day to German?
👍: 0 ⏩: 1
I'm glad you like it. I had not looked into any Locale customizations. This started as meters for myself, but I have added many features to it as requests have come it. I'm not planning on doing a full language selection for all the meters, but I do see a Locale setting for the Date/Time function I am using in Rainmeter. So, it is possible to display the Day and Month in other languages. "FormatLocale=Local" is suppose to use whatever your Windows is set to for Language Locale. And "FormatLocale=de-DE" should set it to German if Local does not work.
I will probably add this into the next version, but until then, you can edit the Clock.ini file, look for these 2 sections and add the FormatLocale=Local to them as shown. Save and Refresh the Clock skin and you should be good. If "Local" does not work, try "de-DE".
[measureMonth]
Measure=Time
Format=%b
FormatLocale=Local
[measureDay]
Measure=Time
Format=%a
FormatLocale=Local
I hope that helps.
👍: 0 ⏩: 1
Hi TGonZo,
thanks a lot - it's working!
👍: 0 ⏩: 0

This skin runs so smooth and lag less! Also how custom it is and the scaling is a lot nicer than other skins I've used. Best Networking and Disk graphs I've seen yet from Rainmeter.
👍: 0 ⏩: 1
BUT thing is. The HWiNFO part of the pack won't work.
I've looked the the comments.
I tried copying the HWiNFO.dll into a plugin folder (I didn't have a plugin folder. so I made one)
and I checked the Sensor ID and and Entry ID.
Some help please?
I'm running Windows 8.1 Pro if that helps.
👍: 0 ⏩: 1
Thanks for the nice comments on my skin. I have not used this on Windows 8, only on Windows 7, but I would think Rainmeter should behave the same. If Rainmeter is installed correctly, then "C:\Program Files\Rainmeter\plugins" folder should exist and should have about 22 dll files in it from the install. If it is not there, then your Rainmeter may be installed in a different location, or you may need to re-install Rainmeter. Either way, once you find the plugins folder with the other dll files, I would try to copy the HWiNFO.dll file to that location with the other dlls, and try it again.
Those are the only suggestions I have. If you continue to have problems with it, I would recommend posting questions to www.hwinfo.com/forum/ and to rainmeter.net/forum/ for more help. I'm sure someone at one of those forums would be able to provide more help. Good luck.
👍: 0 ⏩: 1

It should work on 8.1. I'm running it on Windows 10 with no problems. My Rainmeter is portable. HWInfo had to be installed to work though (at least I couldn't get it working with the portable version of HWI)
👍: 0 ⏩: 0

i have a question for the OP or any tech savvy peeps. i am trying to get the GPU meter to work but the thing is the GPU settings only show me GPU0 which is the integrated one on my motherboard but i want it to show the GPU1 which is a GTX 970 how should i go about doing that? I do have the HWiNFO installed and i did find the IDs and instances but i only get GPU0 info.
screenshot -> prntscr.com/89gzmq
👍: 0 ⏩: 1
I think you need to change all the ID codes in the GPU settings skin to use the GPU you would like to view.
Click the Icon (next to the yellow text) in the GPU settings skin, and that will open the HWiNFO Shared Memory Viewer program, and that will show you the HEX id codes for everything that HWiNFO is collecting data on.
Find the GPU you want to monitor in the Shared Memory Viewer, and change all the HEX IDs in the GPU settings skin.
Make sure you change the Sensor ID as well as the Entry ID for each line.
That should get it to view the GPU you would like.
Hope that helps.
👍: 0 ⏩: 0
Your Skin is really quite interesting and fully functional on Windows 10 x64 Th2.
But I would like to make a suggestion to be incorporated if possible is to be added in CPUmem a way to show also the RPM from cooler processor.
It would be perfect
Thank´s
👍: 0 ⏩: 1
Hi,
Thanks. I'll look at adding that in on the next version.
👍: 0 ⏩: 0
| Next =>