HOME | DD
 TehFeeesh — Data Plot By Speed
by-sa
TehFeeesh — Data Plot By Speed
by-sa

Published: 2012-01-22 06:44:13 +0000 UTC; Views: 35; Favourites: 0; Downloads: 1
Redirect to original
Description
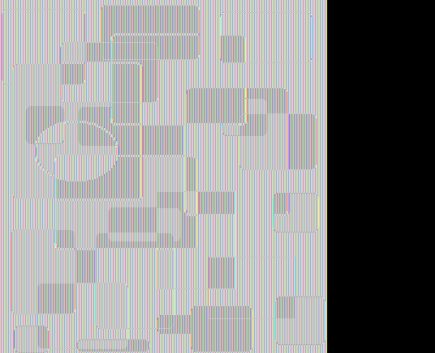
Plot of coordinates from my GPS logger, coloured by speed.Related content


Comments: 2

That bit up the top is done at least twice a day, the bit out to the bottom left the same, top right is the way in and out, residential section is the stuff to the south - that's generally only touched once a day. The main NW->SE line is the main drag out there, I'm up and down that A LOT.
The scale on the top left isn't numbered, but each coloured box is 2 metres per second worth of speed... Magenta is 1-3m/s, next is 3-5m/s
👍: 0 ⏩: 0

wow, are you doing delivery work? that seems like a lot of back and forth driving.
👍: 0 ⏩: 0