HOME | DD
 procrastinating2much — Tomorrow's England

#uk #climate #england #maps #climatechange #mapsandflags
Published: 2020-05-19 16:04:57 +0000 UTC; Views: 6836; Favourites: 112; Downloads: 70
Redirect to original
Description
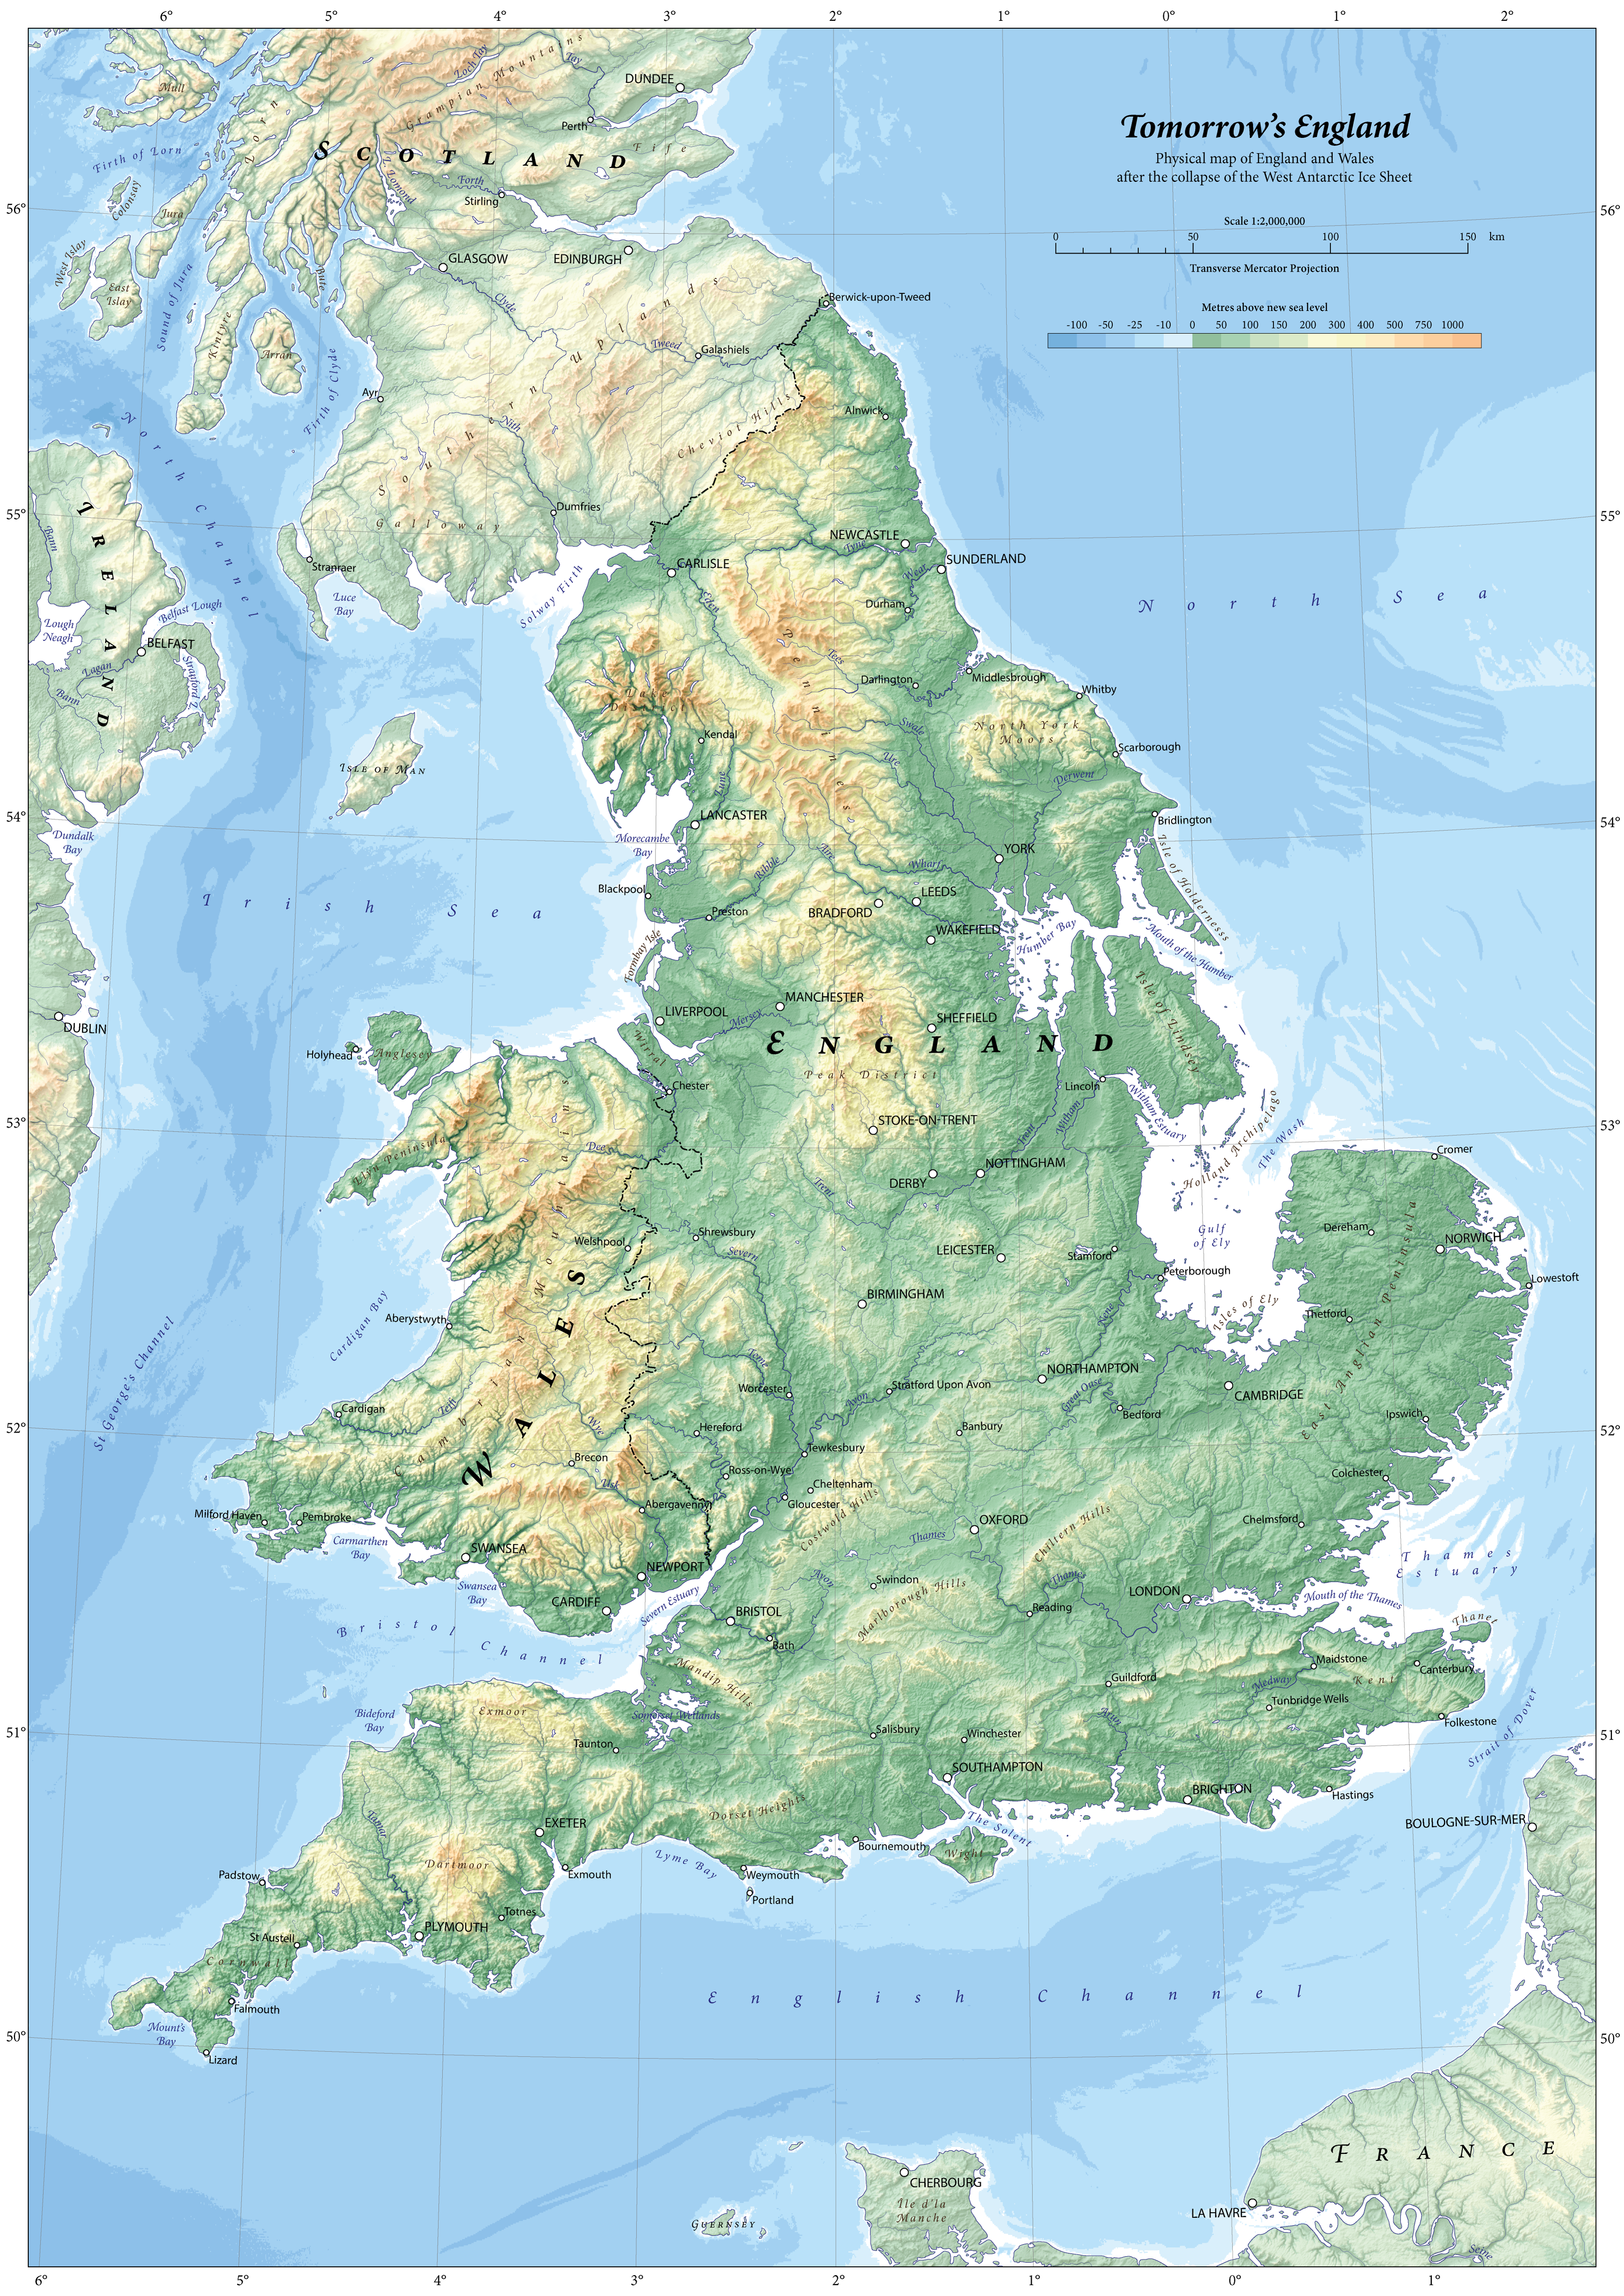
Mercer’s 1978 study, West Antarctic ice sheet and CO2 greenhouse effect: a threat of disaster, predicts the collapse of the West Antarctic Ice Sheet due to man-made climate change in the 21st Century will cause a sudden and devastating sea level rise of 5 metres. This map shows how such a scenario would leave large areas of England inundated.
Sources
---------
Mercer, J. H., 1978. West Antarctic ice sheet and CO2 greenhouse effect: a threat of disaster. Nature, 271(5643), pp. 321-325.
Digital elevation models from…
EU-DEM v1.1, © European Union, Copernicus Land Monitoring Service 2019, European Environment Agency (EEA), available from land.copernicus.eu/imagery-in-… [Accessed December 2019]
This dataset was also used to determine the coastline of England and Wales after a 5-metre sea-level increase. This was done in QGIS by, in the symbology tab, setting the DEM’s minimum value to 5, maximum value to 1250 (or any number above the highest point in the map) and checking the box to clip out of range values. I exported a very high-resolution PNG of the map using QGIS’s print layout function and, in Illustrator, used the ‘image trace’ function, and touching up on the result by hand.
Rivers and lakes from…
EU-Hydro Public Beta, © European Union, Copernicus Land Monitoring Service 2019, European Environment Agency (EEA), available from land.copernicus.eu/imagery-in-… [Accessed December 2019]
Bathymetric data from…
The GEBCO Grid, GEBCO Compilation Group (2019) GEBCO 2019 Grid (doi:10.5285/836f016a-33be-6ddc-e053-6c86abc0788e), available from www.gebco.net/. [Accessed March 2020]
I patched dodgy bits of this data that showed places like the Solway Firth and the Bristol Channel as being weirdly low-lying than they are in real life, likely due to QGIS reading missing data wrong, with Photoshop’s ‘brush’ tool.
Note on colour…
Hypsometric tint and bathymetry colours from cpt-city, a series of colour ramps accessible in QGIS. I deliberately chose a colour scheme that was brighter and more saturated than what I have previously done. This combined with the typography choice of bold lettering with swash capitals creates a retro-futuristic feel to the map that reflects the map’s inspiration: a view of the future from the perspective of a scientist from the 1970s.
Related content
Comments: 4

👍: 2 ⏩: 0

The 'Sudden and Drastic' part, of course, is one of the most interesting tidbits. Are we talking about an inundation within twenty years? Five? One? I couldn't find Mercers' paper, but a nature transcript from 98 gave some estimates from other sources in the range of 400, 500 years.
Ugh I sound like a denier or skeptic. I hope I don't come across that way - I'm earnestly interested. Though even the 'long' estimate is still horrific; 500 years really isn't that long in the terms of 'states' and England and Wales and Scotland and all the rest would still be around then, and of course anything faster is of even more concern vis-a-vis governmental response, social response, personal response....
👍: 0 ⏩: 1

👍: 1 ⏩: 0


